Monitoring End-to-End IP QoS
Internet is now almost everywhere in the civilized and half-civilized world available. It’s only a question of price and Quality of Service. In my home in Bangkok I suffered from an ever changing quality of my Internet connection. Sometimes it is excellent and sometimes extremely slow with almost unusable VoIP Telephony.
At those moments I observed a high packet loss using the Ping tool on my PC.
The DSL line is using ADSL2+ and I get about 15Mbps downlink and 1 Mbps uplink. It is connected to TOT’s (Telephone Organization of Thailand) network. But the problems I am observing are certainly not on the DSL link, but in the network’s backbone or international gateways. My first hop, from my ADSL router to the default gateway in TOT’s network, is quite stable.
To get a better impression of my overall quality beyond my punctual observations, I started this little project.
The idea was to observe two indicators: packet loss and round trip time (RTT). Both are easily available with the Ping tool. A third interesting indicator would be the change of RTT over a serious of pings, e.g. the jitter. If this value is high, we are probably shortly before congestion somewhere on the way, as buffers are filling up. Using Pings end-to-end we can’t tell were the problem lies. Is it on the way from the ping sending host to the destination, or somewhere on the return path? At the local ISP or the international carrier? We can’t blame any part of the network with this simple test. We could drill further down, and ping specific routers on the path, which we could discover with the Traceroute tool. This is out of scope of this experiment and will be saved for later. Here I want to show how easily we can collect some interesting data and get a fact based view of the end-2-end quality we get, opposed to the subjective perception and punctual tests.
Ping
The Ping tool sends an ICMP (Internet Control Message Protocol) packet (Echo Request) to the remote host, which answers with an Echo Reply. The tool can detect the general reachability (if the remote host supports ping) and calculate the time between sending the ping packet and the reception of the reply, e.g. the RTT. IP is by definition not a reliable protocol and packets will simply be discarded, if they can’t be forwarded within a specified time, or the waiting queue is full. Ping calculates the percentage of lost packets, e.g. no reply received, over a series of ping requests.
root@host1:/home/stefan# ping -c 3 xxx.dyndns.org
PING xxx.dyndns.org (101.109.xxx.yyy) 56(84) bytes of data.
64 bytes from node-wmd.pool-101-109.dynamic.totbb.net (101.109.xxx.yyy): icmp_req=1 ttl=51 time=424 ms
64 bytes from node-wmd.pool-101-109.dynamic.totbb.net (101.109.xxx.yyy): icmp_req=2 ttl=51 time=401 ms
64 bytes from node-wmd.pool-101-109.dynamic.totbb.net (101.109.xxx.yyy): icmp_req=3 ttl=51 time=425 ms

--- xxx.dyndns.org ping statistics ---
3 packets transmitted, 3 received, 0% packet loss, time 2000ms
rtt min/avg/max/mdev = 401.592/417.013/425.134/10.922 ms
Collecting Data
The tested connection is between a Host Europe server in Germany and an ADSL router in Bangkok connected to TOT’s network.
I wrote a script to send 100 ping requests every 15 minutes and write time, average RTT and packet loss into a log file. Another script reads those data and generates daily graphs with the help of Gnuplot.
The scripts run on the Host Europe (HE) server.
The Results
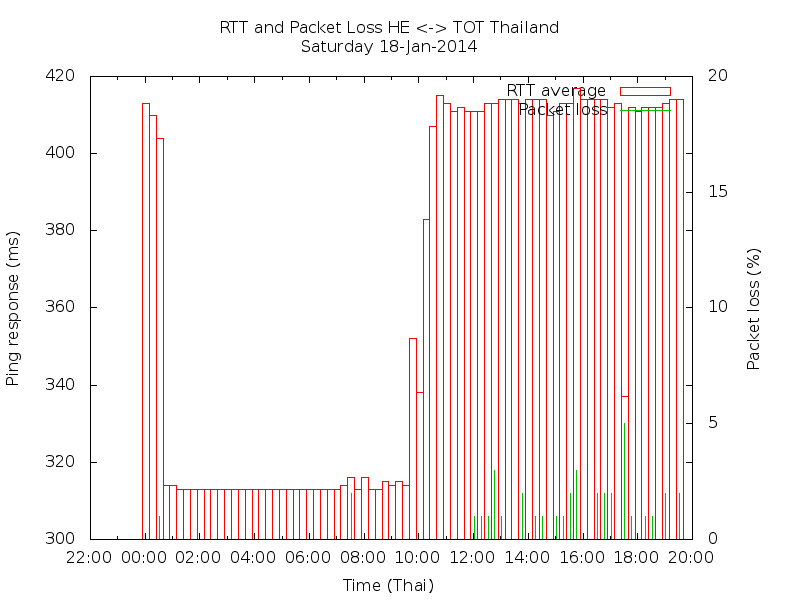
One of the first results I have got is the following diagram. Actually a full calender day should be covered, but I had some problems with the time zones.

What we can observe here is that there were heavy problems after 12:00 with high packet losses over 20%. At around 14:00 the packet loss problem disappeared, but the RTT increased from 330ms to 430ms. Most probably the routing has changed at this time, avoiding a congested or erroneous route and using a longer but more reliable route. Around 16:00 another routing change happened and the RTT went down again to about 300ms.
This simple approach allows already a good assessment of the QoS and reliability of a specific connection over a defined period and tells much more than some isolated pings. Anyway, routing can change quickly and depends on the destination as well as operators decisions often based on carrier’s interconnection fees, which probably also change over the day. The lowest seen RTT on this route was 240ms. Unfortunately I could enjoy this only for a few days and haven’t seen this ever again.
My collection of ping data continues and live data of the connectivity between a Host Europe server in Germany and a TOT DSL line in Thailand can be seen here: Update: Since I move to Germany, the live monitoring of my Thai DSL line is stopped.
pingstat.bytebasket.com
Let me know if you are interested in the used scripts.
Update (23 Jan 2014)
I did not trust my DSL line, although error counters in the modem were all zero. So I collected the same data for the two segments separately 1) from DSL Router to the default gateway (first hop) and 2) from the server in Germany to the default gateway in TOT’s network. Result: the RTT was quite consistent, the DSL adding a latency of about 17ms, but the e2e RTT graph looks basically the same with and without the DSL segment. But I found that the first segment (DSL+DSLAM) added quite a few lost packets to the end-2-end statistics. I have no idea yet were they get lost. It is also important to note that packet loss does not have any impact on the RTT presented by the Ping tool. Lost packets are simply ignored in the RTT summary. Just looking at RTT is not enough, there could be a lot of lost packets and RTT would still look fine.
To drill further down, the next step would be to use a bit more sophisticated tools such as Iperf.
![]()

